In July The Annie E. Casey Foundation (AECF) issued the 25th edition of the KIDS COUNT Data Book. The KIDS COUNT Data Book takes a look at 16 indicators of well-being from 4 domains in order to observe state and national trends in child well-being. Data used are from 2012, which is the most recent available. Trends are derived from comparing this data with data from 2005.
Domains With Their Indicators
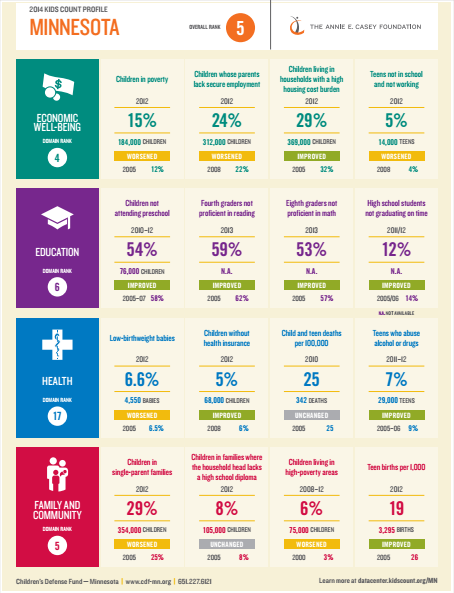
Economic Well-Being |
Children in poverty | Children whose parents lack secure employment | Children living in households with a high housing cost burden | Teens not in school and not working |
Education |
Children not attending preschool | Fourth graders not proficient in reading | Eighth graders not proficient in math | High school students not graduating on time |
Health |
Low-birthweight babies | Children without health insurance | Child & teen deaths per 100,000 | Teens who abuse alcohol or drugs |
Family & Community |
Children in single-parent families | Children in families where the household head lacks a high school diploma | Children living in high-poverty areas | Teen births per 1,000 |
National Trends
According to the KIDS COUNT Data Book, both the Education and Health domains saw positive gains in all of their indicators, while the Economic Well-Being and Family and Community domains experienced some setbacks. Most likely this is due in part to the 2008 economic recession. In sum, 11 out of the 16 indicators saw improvements.
Some national notable trends are:
- Children in poverty increased from 19% in 2005 to 23% in 2012.
- Children living in high-poverty areas increased from 9% in 2000 to 13% between 2008 and 2012.
- Children whose parents lack secure employment rose from 27% in 2008 to 31% in 2012.
- The percentage of high school students not graduating on time decreased from 27% in 2005/2006 to 19% in 2011/2012.
- The rate of teen births per 1,000 also decreased, from 40 in 2005 to 29 in 2012.
The KIDS COUNT Data Book did find that even with the majority of indicators seeing positive gains, racial inequities were still evident, with African American, American Indian, and Latino children experiencing negative outcomes at higher rates than the national average; for example:
| African American | American Indian | Hispanic | National Average | |
| Children in poverty | 40% | 37% | 34% | 23% |
| High school students not graduating on time | 32% | 32% | 24% | 19% |
| Children without health insurance | 6% | 16% | 12% | 7% |
| Teen births per 1,000 | 44 | 35 | 46 | 29 |
For more information on racial inequities, check out the AECF Policy Report Race for Results: Building a Path to Opportunity for All Children.
Well-Being in Minnesota
In last year’s KIDS COUNT Data Book, Minnesota ranked 4th in overall well-being. This year, Minnesota ranks 5th in overall child well-being, behind Massachusetts, Vermont, Iowa, and New Hampshire. The lowest ranking states are Nevada, New Mexico, and Mississippi. In terms of the domains, Minnesota ranks 4th in Economic Well-Being (better than the national average in all indicators), 6th in Education (the same or better than the national average in all indicators), 17th in Health (slightly worse in one indicator, but better in the other 3), and 5th in Family and Community (better than the national average in all indicators).
 Compared to last year, Minnesota’s ranking improved in Economic Well-Being and Education, stayed the same in Family and Community, and declined in Health. However, when comparing 2012 data with 2005 data, Minnesota has actually worsened in 3 out of the 4 indicators in Economic Well-Being, 1 out of 4 indicators in Health (with one indicator remaining unchanged), and 2 out of 4 indicators in Family and Community (with one indicator remaining unchanged).
Some notable areas in which Minnesota fared better than the national average were children in poverty (15% vs. 23%), eighth graders not proficient in math (53% vs. 66%), low birthweight babies (6.6% vs. 8.0%), children living in high-poverty areas (6% vs. 13%), and teen births per 1,000 (19 vs. 29).
There are a few areas in which we need to work, notably the Health domain. This was the only domain where Minnesota fared worse in one indicator: Teens who abuse alcohol or drugs (7% vs. 6%). We also were nearly on par with the national average for child and teen deaths per 100,000 (25 vs. 26). The indicator where Minnesota was tied with the national average was in the Education domain: Children not attending preschool (54% for both Minnesota and nationally).
Policy Implications
While the KIDS COUNT Data Book presents quite a bit of national and state data pointing to trends in child well-being, there are no specific policy solutions presented in the report. Within each domain, however, a state who has shown improvements in a certain indicator is featured, with a description of how such improvements were made (e.g. “Health Insurance Coverage Improves Among Children in Arkansas” outlines the policy and programmatic steps taken to reduce the percentage of uninsured children from 22% in 1997 to 6% in 2012).
In Minnesota, the last few years have seen a greater focus on high quality child care and early childhood education, health, and public assistance programs. For example, during the 88th legislative session (2013-2014) the legislature passed laws
- increasing funding for child care providers and centers with high Parent Aware ratings,
- funding all-day kindergarten,
- expanding early learning scholarships for children ages 3-5,
- restoring absent days for children whose parents receive child care assistance, from 10 to 25,
- creating housing assistance grants for families on MFIP,
- repealing the MFIP family cap,
- increasing the state minimum wage,
- expanding child and family eligibility for medical assistance, and
- preventing exposure to secondhand smoke among children and youth in foster care.
As always, CASCW encourages policymakers and advocates to consider the research and data prior to developing policy solutions. Evidence-informed policy solutions are key to ensuring the well-being of our children and families. For examples of promising and evidence-informed policy solutions to prominent issues, check out our child welfare policy briefs.